Topic 4.1 - Individuals, firms, markets and market failure
Snapshot of the AQA syllabus topic area we’ll be covering in this post.
THE DETERMINANTS OF DEMAND FOR GOODS AND SERVICES: PRICE DETERMINATION IN COMPETITIVE MARKETS
AQA students must understand the following content [taken from the syllabus]
A demand curve shows the relationship between price and quantity demanded.
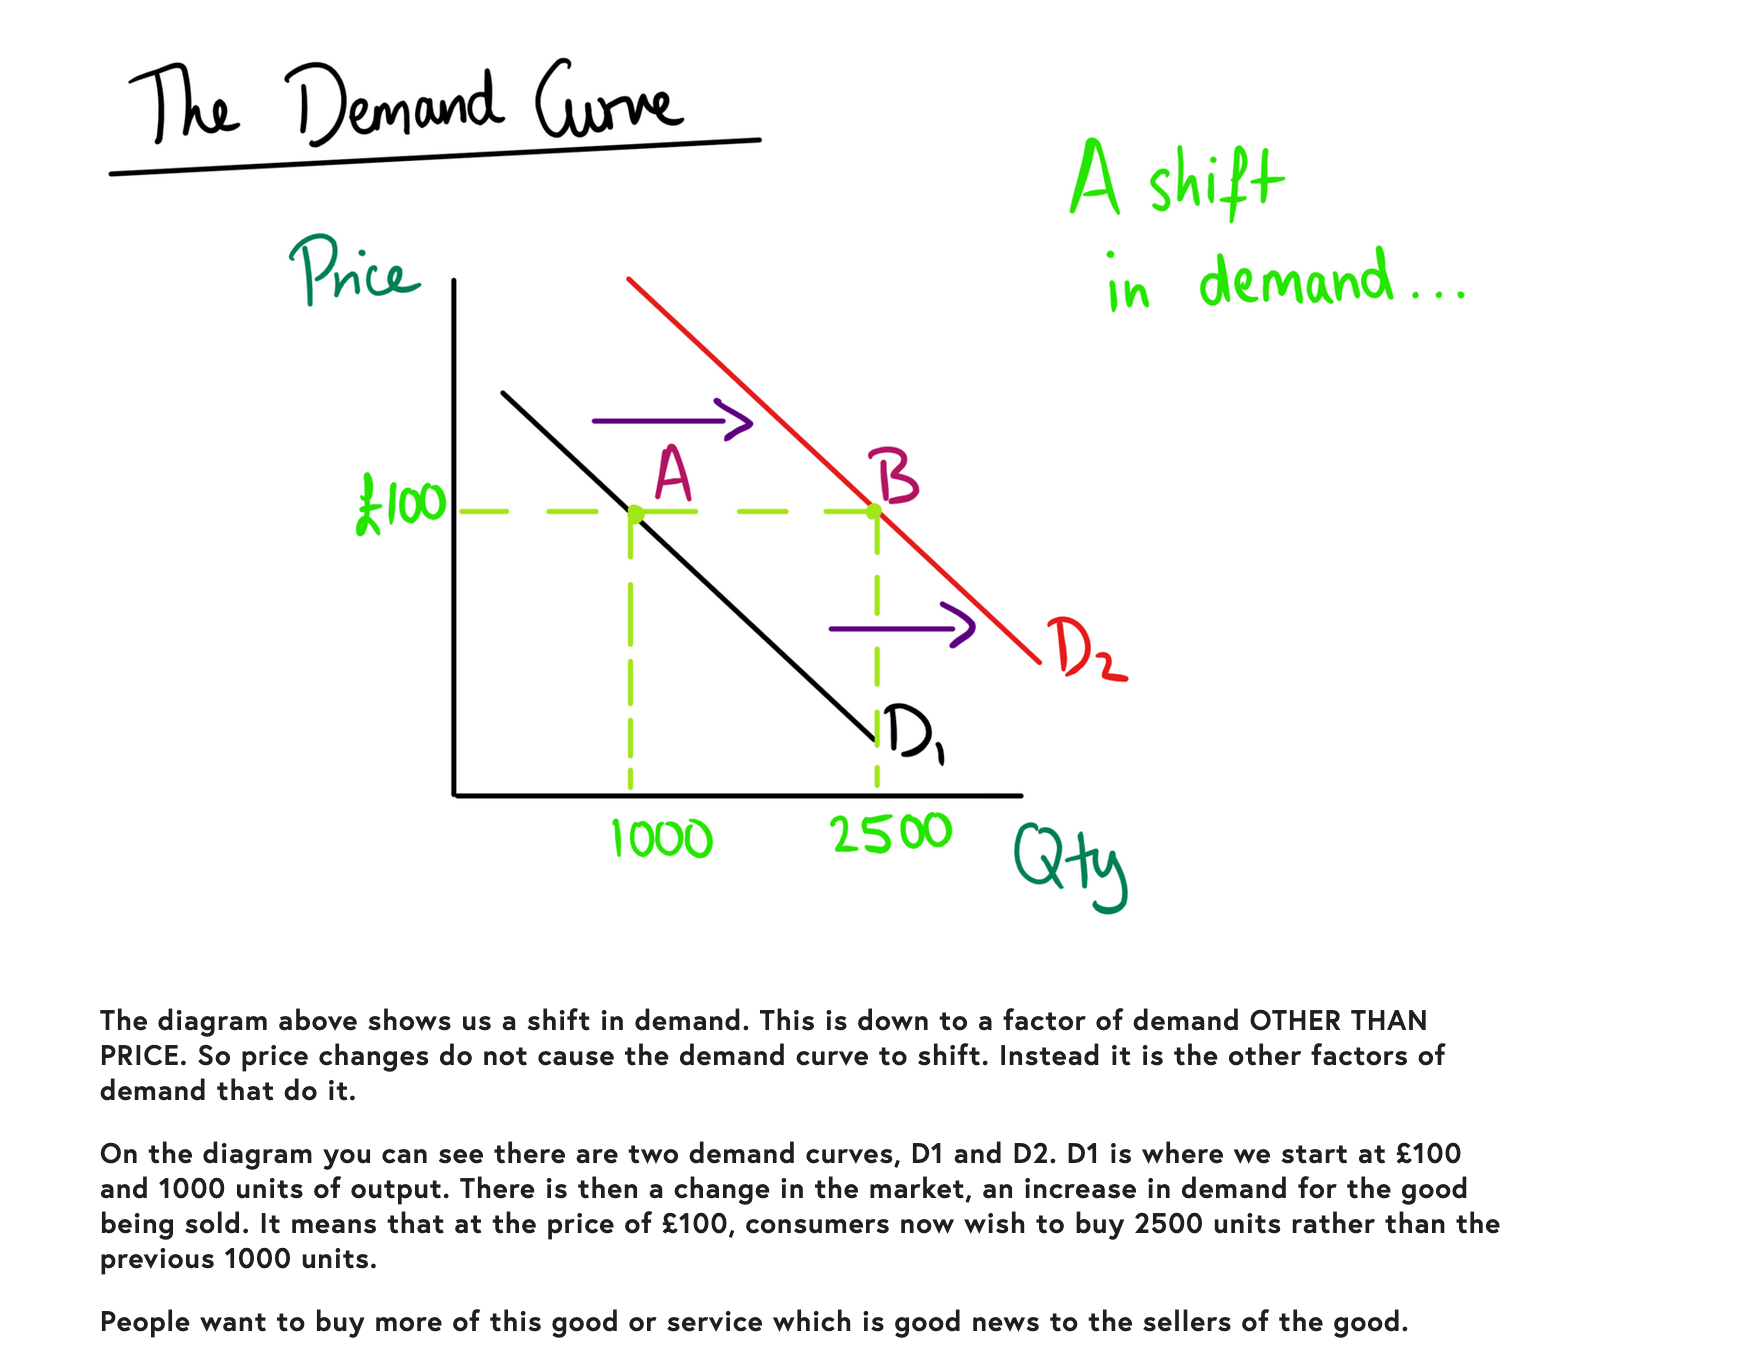
The causes of shifts in the demand curve.
INFORMATION YOU NEED TO KNOW
Introduction:
Understanding the factors that influence demand in economics is essential for analysing consumer behaviour and forecasting market outcomes. A key tool for comprehending market dynamics is the demand curve, which shows the relationship between the price of an item or service and the amount that is demanded. The main driving forces behind demand for goods and services are examined in this article, along with the reasons behind changes in the demand curve.
The Demand Curve:
The demand curve serves as an example of how price and quantity demanded are inversely related. When all other elements are held constant, it shows consumers' willingness and ability to buy a certain good or service at various price points. The amount demanded tends to rise when the price declines, ceteris paribus (everything else being equal), and vice versa. A fundamental idea in economics is that there is a negative correlation.
Causes of Shifts in the Demand Curve:
Although shifts in the demand curve are influenced by many factors other than price, changes in price cause movements along the demand curve. Understanding these factors makes it easier to explain how consumer behaviour and market demand vary over time. Shifts in the demand curve are primarily caused by:
Income: Demand is significantly influenced by consumer income. People have more purchasing power when their income improves, which increases demand for a variety of goods and services. This link is best demonstrated by the demand for normal goods, which rises as income rises. However, when income increases, there is a decline in demand for inferior goods.
Price of Related Goods: Demand may be impacted by the costs of complementary and substitute products. Products that can be substituted for one another include things like coffee and tea. Usually, when the selling price of one substitute rises, the demand for the other does too. Contrarily, complementary items are used in conjunction with one another, such as petrol and cars. The demand for one complimentary good may decline if the price of the other rises.
Consumer Preferences and Tastes: Demand is influenced by consumer preferences and tastes. The demand from consumers for particular goods and services can be influenced by shifts in popular trends, cultural shifts, advertising, and personal preferences. For instance, rising interest in health and wellbeing may result in more people buying organic food.
Expectations: Current demand may be impacted by consumer expectations about the future of the economy, prices, or product availability. Consumers may increase their current demand and buy goods today at a cheaper price - that is, if they expect prices to rise in the future. For example, purchasing a house today at a lower price in the anticipation its value will rise.
Demographic Factors: Demand is influenced by demographic factors such population number, age distribution, and income distribution. Age group transitions or growing populations are two examples of demographic changes that can significantly affect the market demand for particular goods and services. For instance, the need for healthcare services may rise as the population ages.
Conclusion:
Analysing consumer behaviour and forecasting market outcomes require a thorough understanding of demand factors. While the relationship between price and quantity is shown by the demand curve, changes in the demand curve are caused by a variety of other factors, such as income, the pricing of related commodities, consumer preferences, expectations, and demographic considerations. When deciding on production, pricing, and marketing tactics, economists and businesses can make better-informed choices that will ultimately lead to market success by taking these determinants into account.
SUPPORTING DIAGRAMS

![AQA ECONOMICS A-LEVEL SPECIFICATION SYLLABUS TOPIC 4.1 [FACTORS OF DEMAND FOR GOODS AND SERVICES]](https://images.squarespace-cdn.com/content/v1/55b690f2e4b076db679cd340/be38e290-5c2d-427c-864f-bba394ddbcaa/AQA+ECONOMICS+A-LEVEL+SPECIFICATION+SYLLABUS+TOPIC+4.1++%5BFACTORS+OF+DEMAND+FOR+GOODS+AND+SERVICES%5D)

